Quick guide
User manual
A practical guide to master the 5 Thinking Processes of the Theory of Constraints inside TOC Thinking Tools. Every section is illustrated with a real end-to-end example — a demo project called <em>Reducing customer support response time</em> — so you can see exactly how each tool is used in practice.
1. What is TOC Thinking Tools?
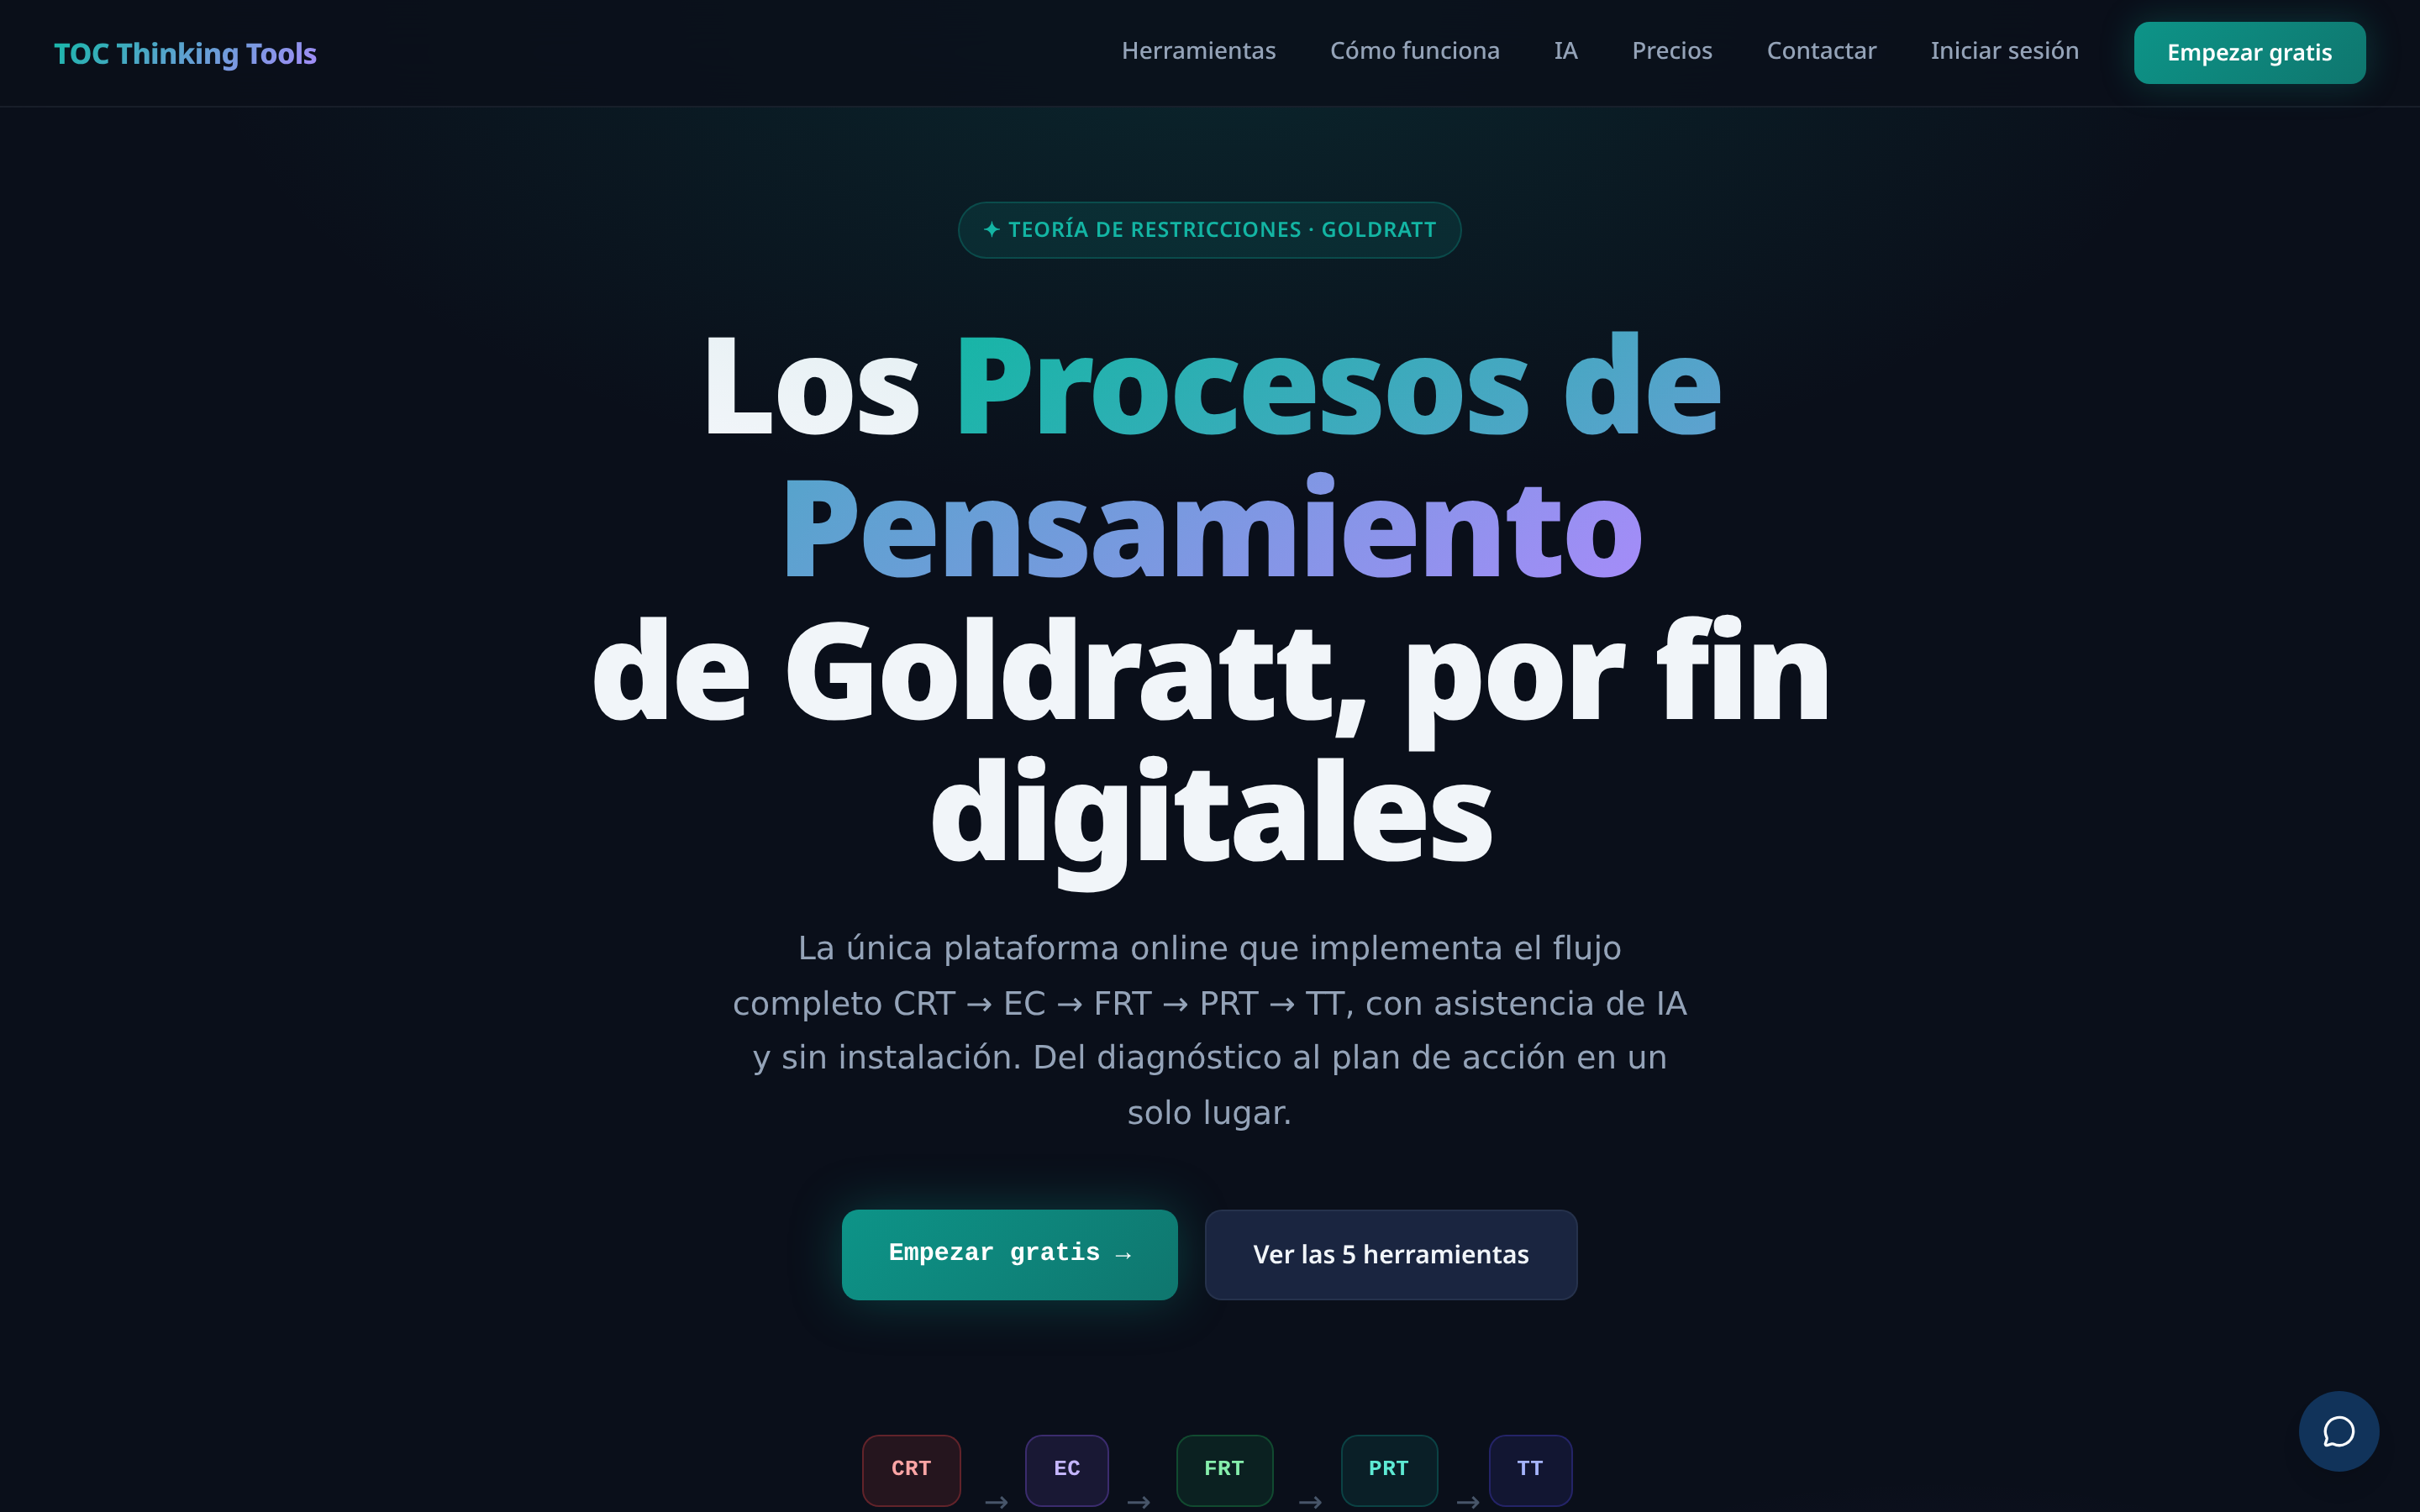
TOC Thinking Tools is a web platform that digitizes the 5 Thinking Processes of Eliyahu M. Goldratt's Theory of Constraints. It walks you, step by step, from diagnosing a chronic problem to a concrete action plan.
The 5 tools and what they are for
- CRT (Current Reality Tree) — pinpoints the root cause that produces every symptom.
- EC (Evaporating Cloud) — dissolves the chronic conflict sustaining that root cause.
- FRT (Future Reality Tree) — projects the desired state after applying the injections.
- PRT (Prerequisite Tree) — maps obstacles and intermediate objectives to get there.
- TT (Transition Tree) — defines concrete steps, owners and dates.
Our worked example throughout this manual
Every section uses the same demo project — «Reducing customer support response time» — so the concepts stay concrete. The problem: average first-response time is above 24h, customers complain publicly on social media, and the support team is burning out. You'll see how each tool contributes to a plan that brings that time below 4h.
What makes the platform different
- AI assistance specialized in TOC: contextual suggestions, gap detection and semantic validation.
- Automatic logical validation: deterministic rules + semantic layer that flag orphan UDEs, injections without effects, cycles, contradictory causes, etc.
- Real-time collaboration with visible presence, roles and sub-second sync.
- Reasoning history: every decision and AI suggestion is recorded and auditable.
2. Create an account and pick a plan
From Get started free (top-right of the landing) or from Pricing you can sign up with email + password or Google.
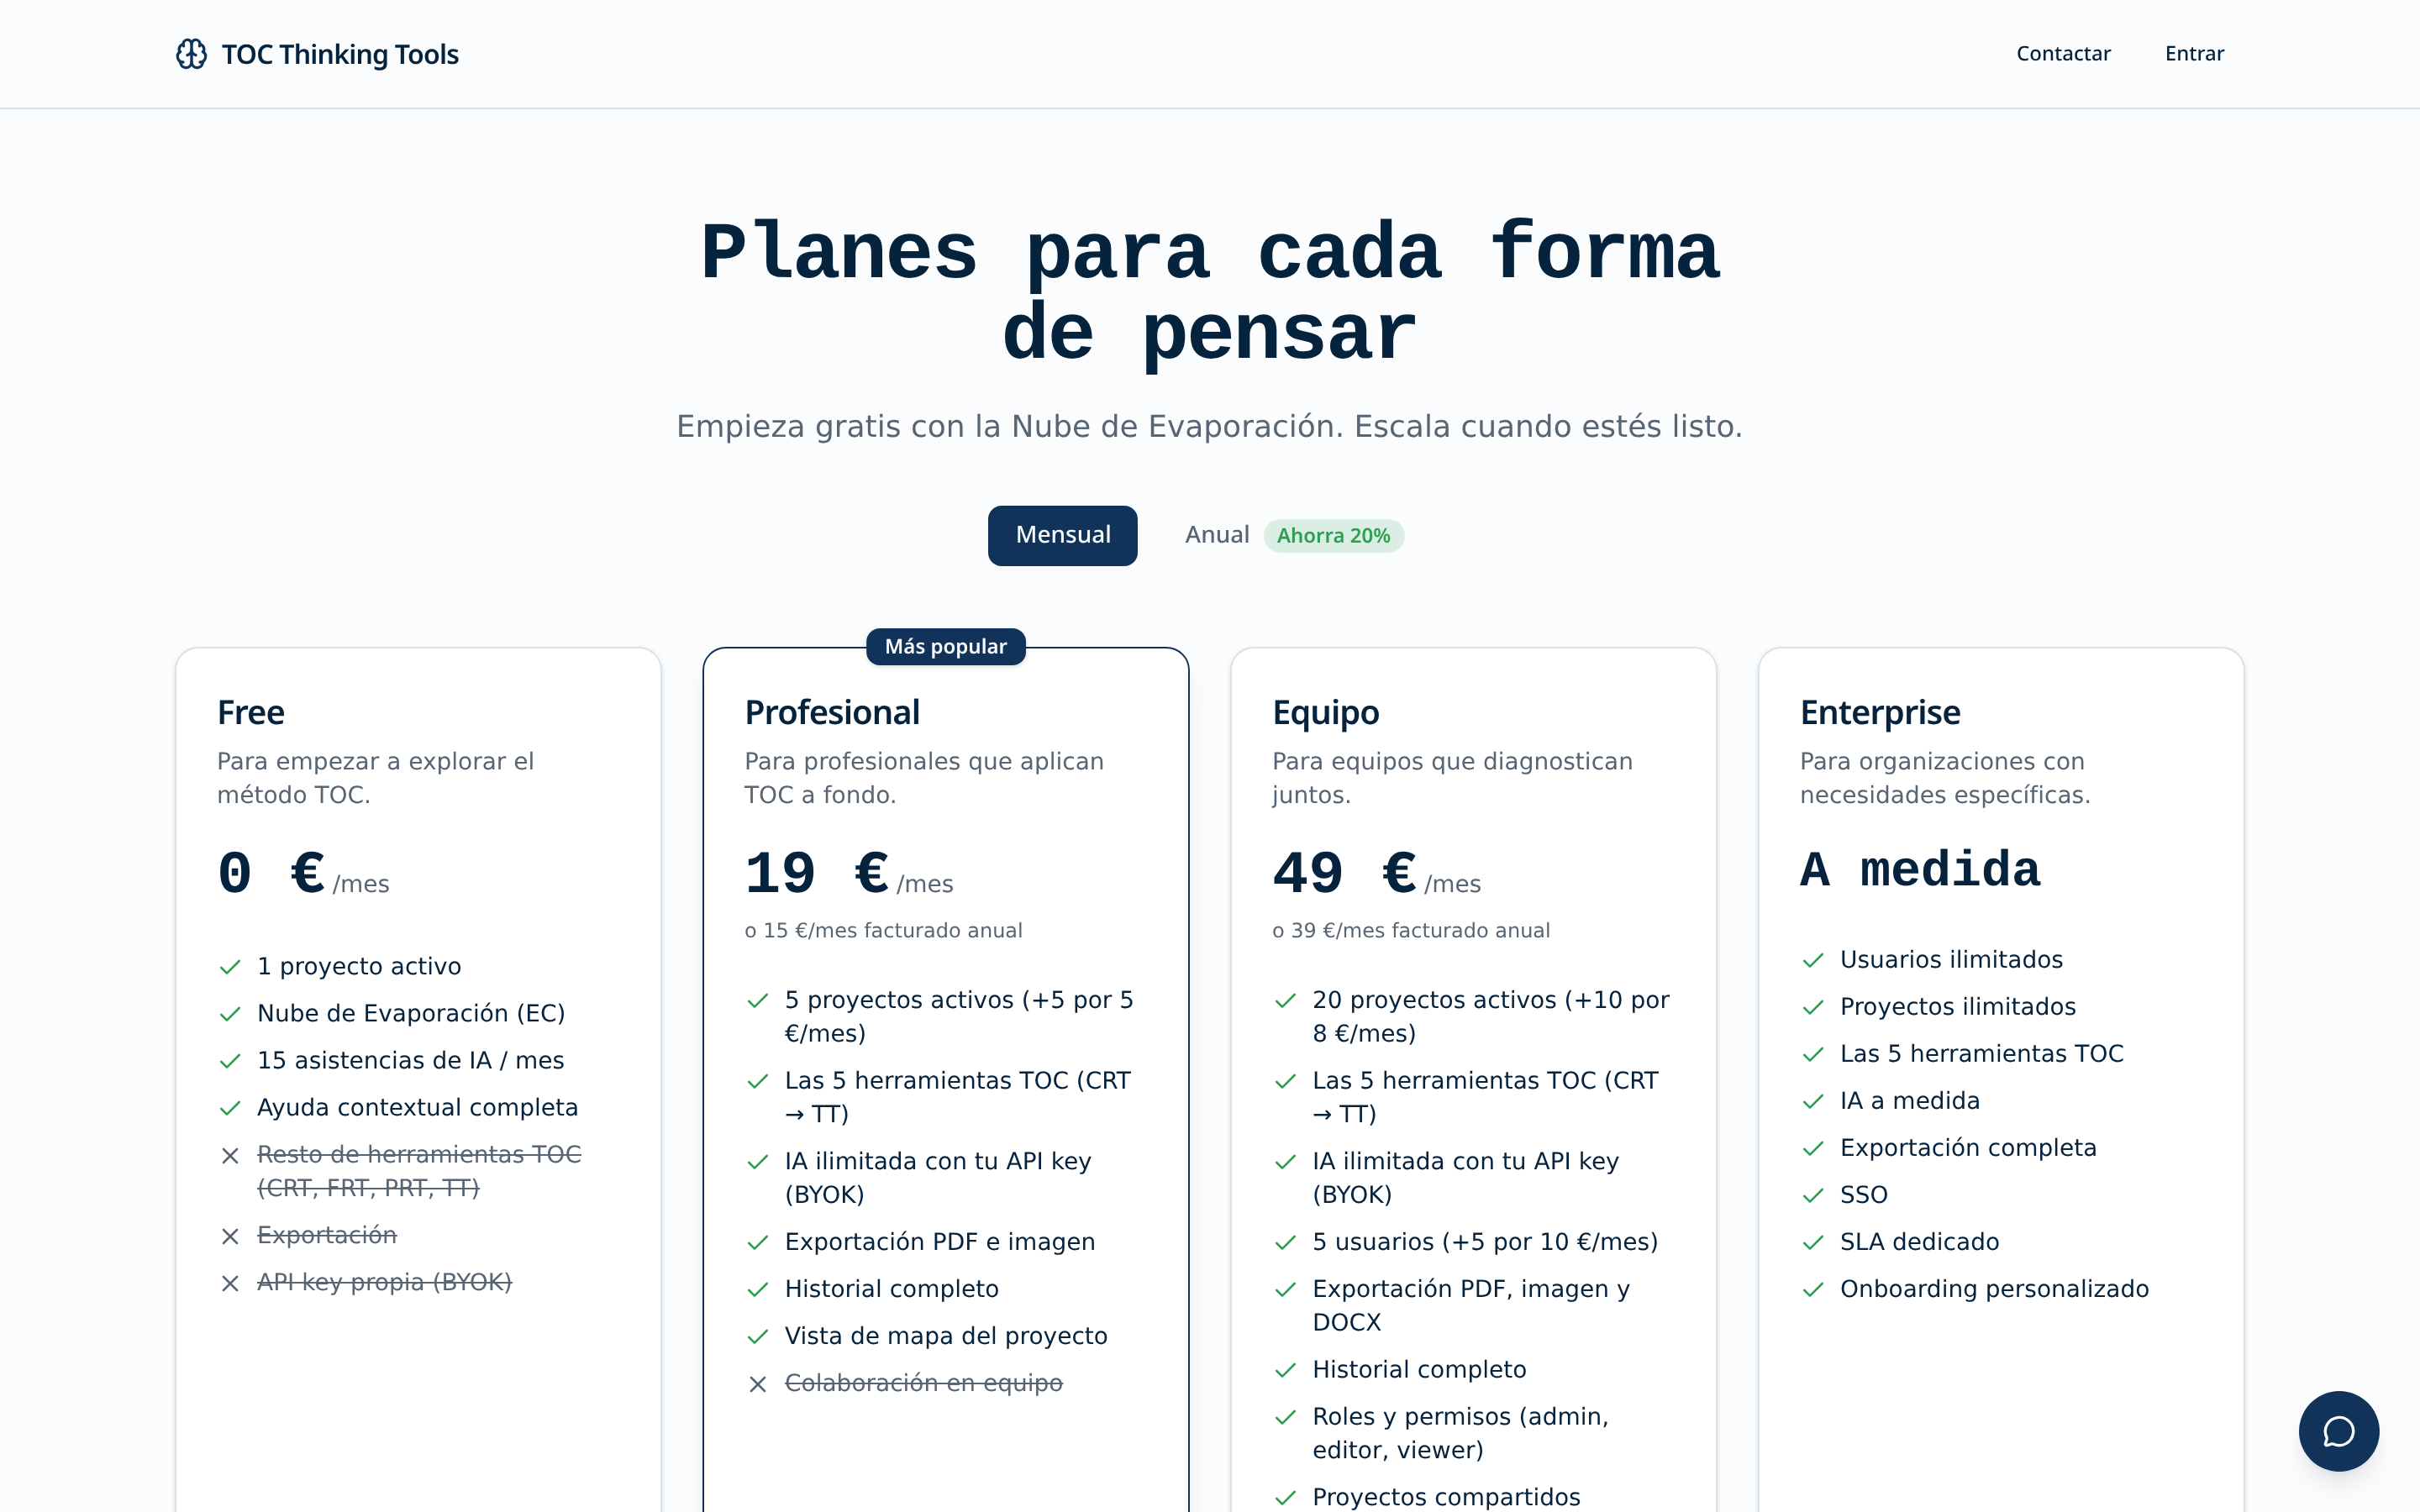
Available plans
- Free — 1 active project, all tools, limited AI (10 help queries/day and a reduced quota in the in-tool assistants). Perfect for evaluating the methodology.
- Pro — unlimited projects, expanded AI quota, PDF export and priority support. Designed for consultants and small teams.
- Team — everything in Pro plus multi-user collaboration with roles (Admin / Editor / Viewer), real-time presence, invitations and per-member audit trail.
Request information / manual billing
If your company needs a formal invoice, EU VAT reverse charge, a master agreement or bulk licensing, click Request information on any plan. The team gets back to you within 48 working hours and sets up the subscription manually.
Changing plans
You can upgrade at any time from Settings → Subscription. Changes take effect immediately and are prorated. Downgrades apply on the next cycle; projects that exceed the new limit become read-only but are never deleted.
3. The Dashboard: your projects
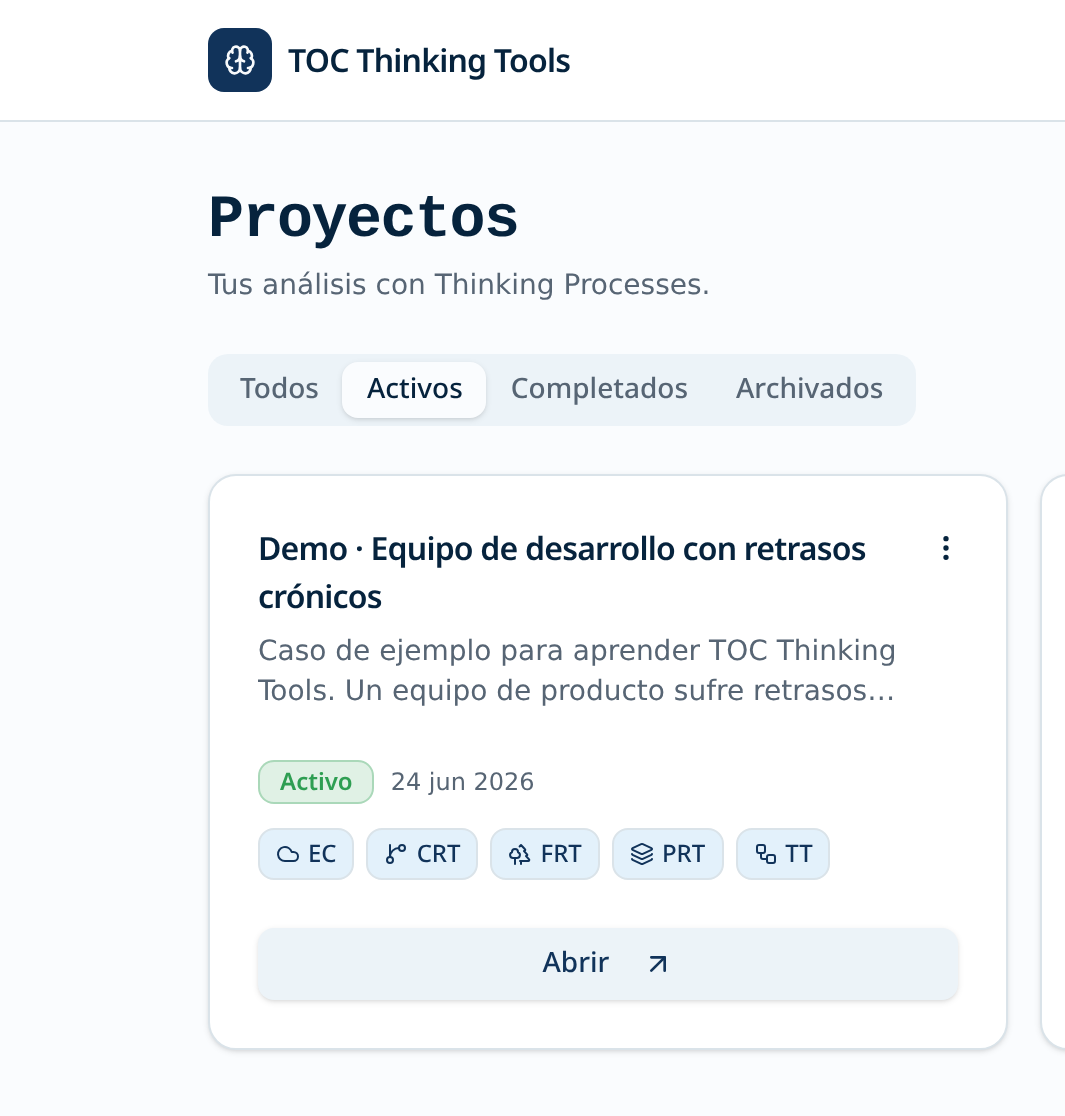
Once signed in you land on the Dashboard. It's your command center: every project grouped by status (Active, Completed, Archived).
Anatomy of a project card
- Title and description — the problem statement or initiative.
- Tool chips — EC, CRT, FRT, PRT, TT color-coded by status (draft, in progress, completed).
- Progress bar — percentage of tools completed.
- Members — avatars of people with access (Team plan only).
- Last updated — who edited last and when.
Creating a project
Click + New Project in the top right. You'll be asked for a short title (a problem statement, not a solution) and an optional description with context. A good title starts with a verb or a painful noun: «Reducing customer support response time», «Cutting lead time in half», «Excessive sales rep turnover».
The example project we use in this manual has the description: «Average first response is above 24h, customers complain on social media, and the support team is burning out. Target: bring first response below 4h in 90 days.»
Search, filter and sort
The top bar lets you free-text search and filter by status. Projects are sorted by last update by default. You can archive completed projects from the ⋯ menu on each card; they remain accessible but no longer count against your plan limit.
4. Inside a project
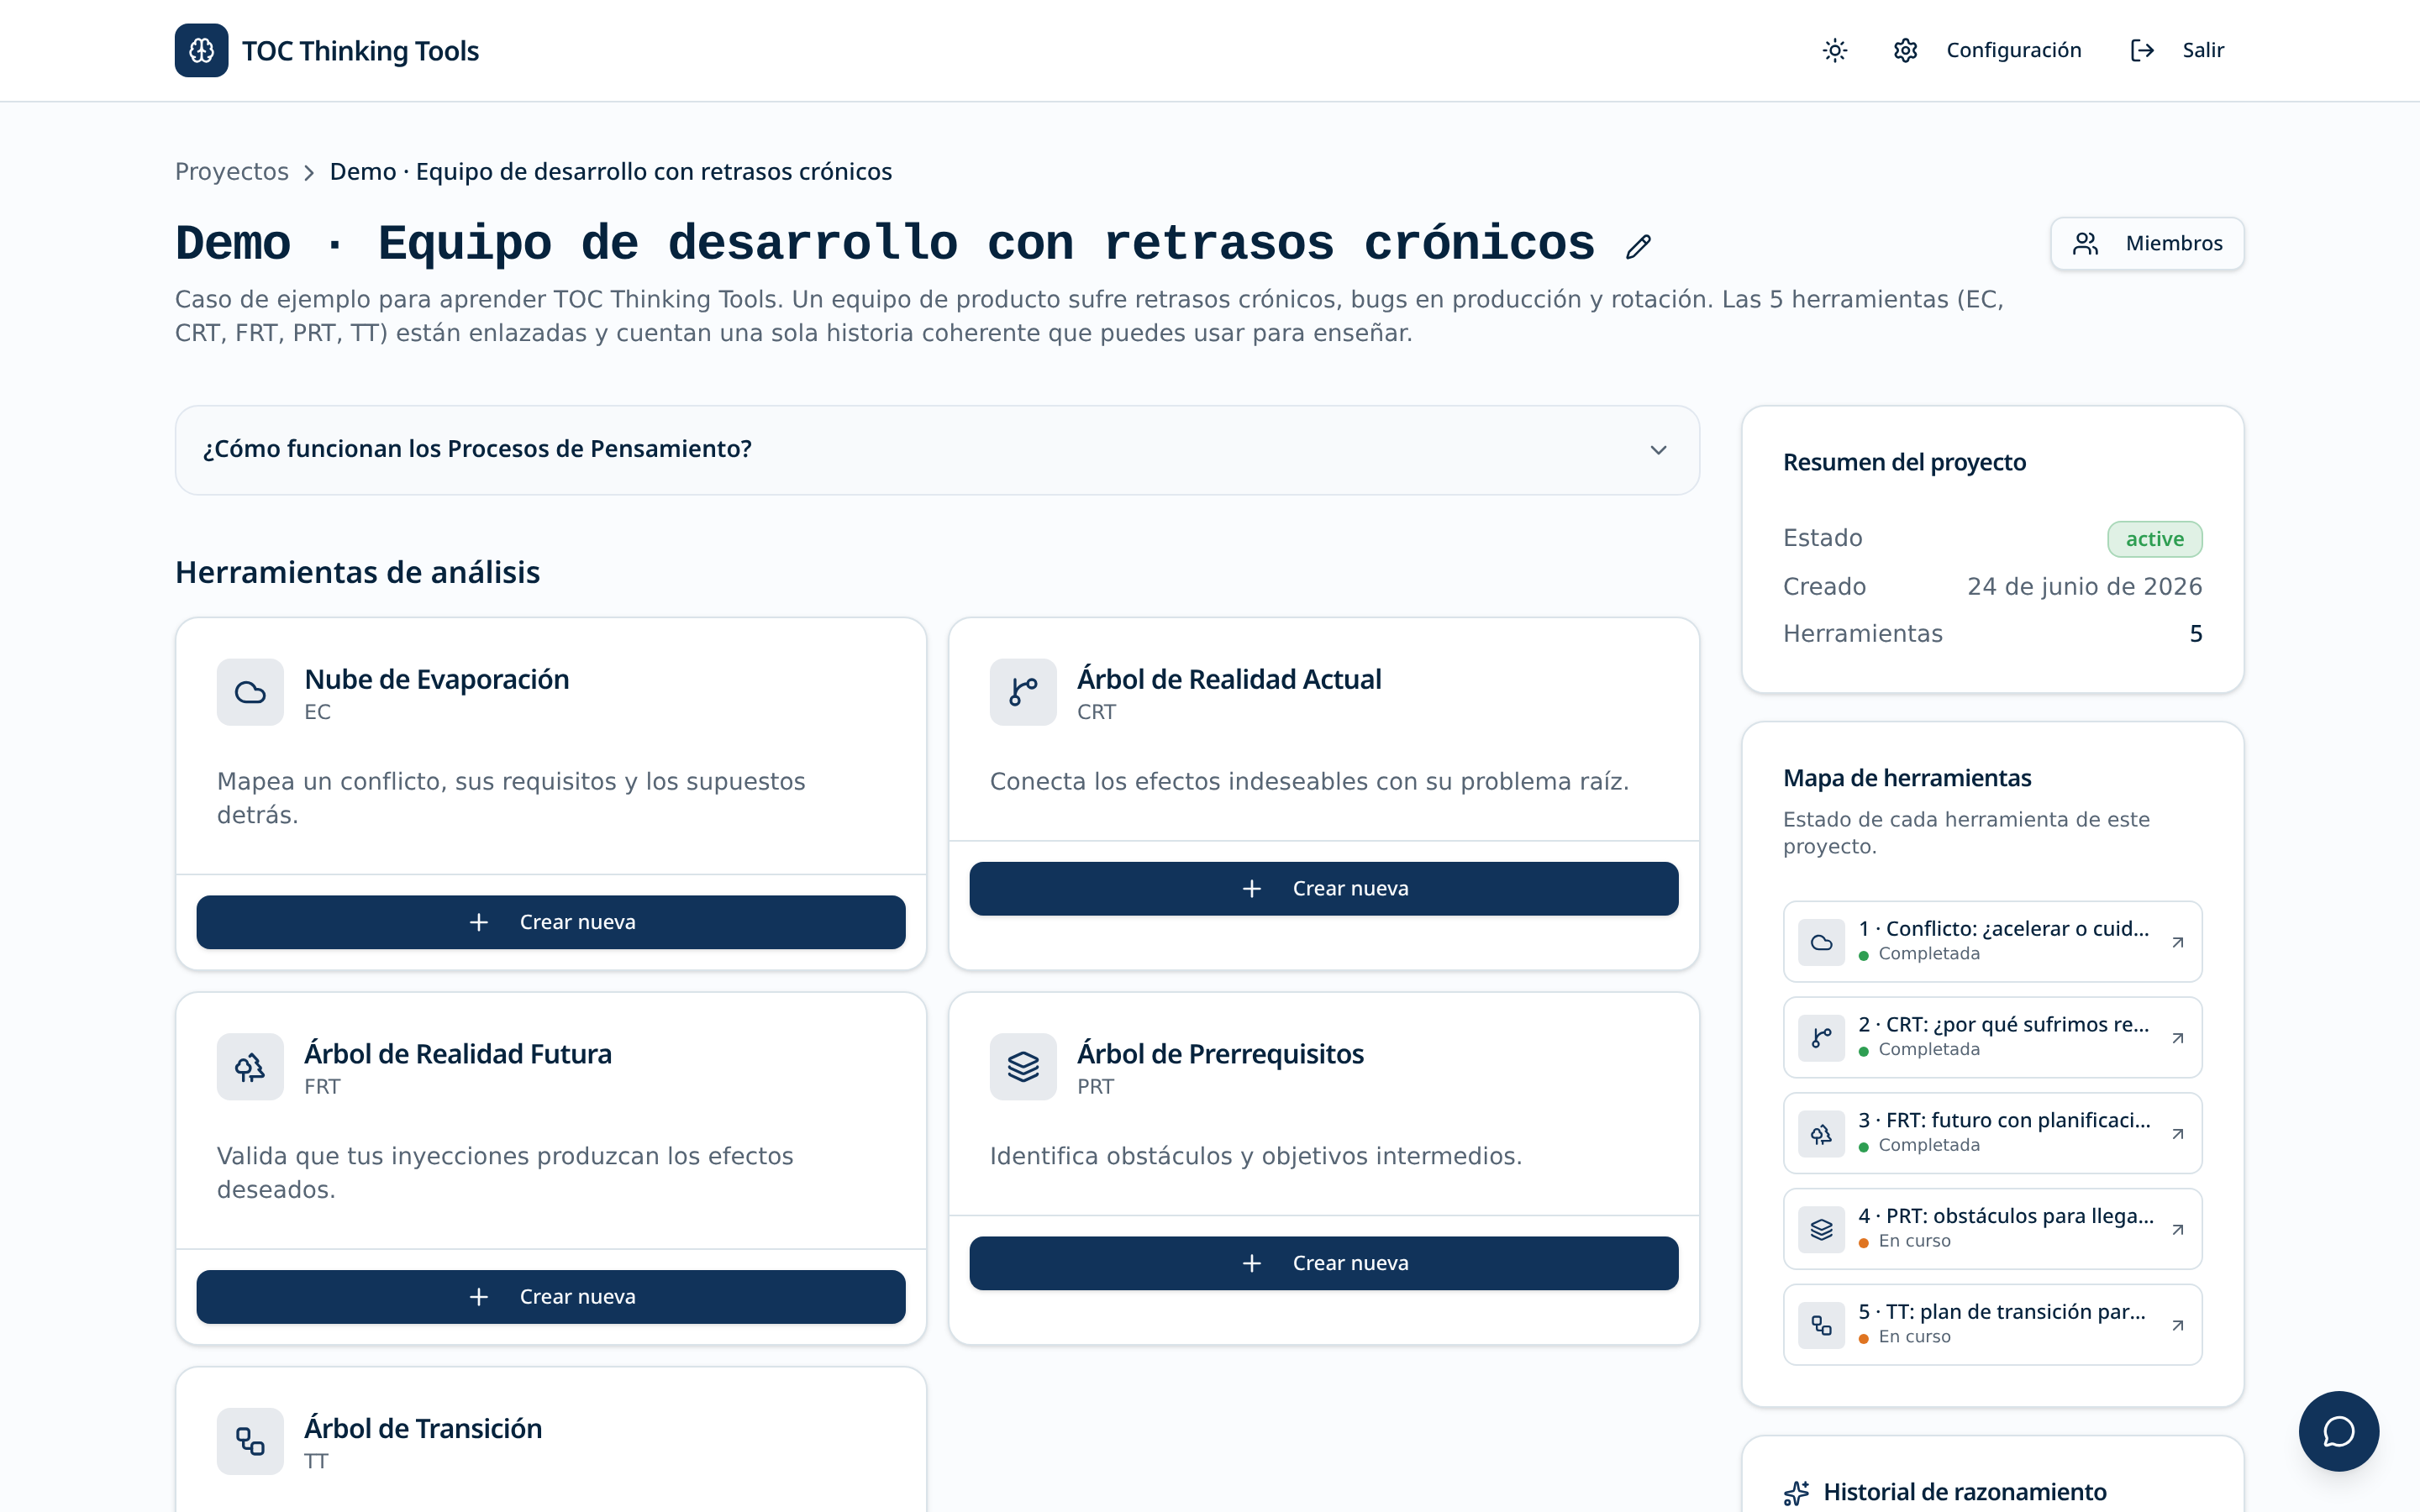
Opening a project shows the 5 analysis tools as cards, each with its current status and a direct button to enter or create.
Side panel (right)
- Project summary — description and last activity.
- Progress analysis — timeline with events: project created, tools started/completed, AI suggestions accepted, members added.
- Reasoning history — every AI call with its context, the proposal and whether it was accepted or rejected. Your auditable decision log.
Members and roles (Team plan)
Click Members (top-right corner) to invite people by email. Roles:
- Admin — edits everything, manages members and deletes the project.
- Editor — edits tools and uses AI, cannot manage members.
- Viewer — read-only, perfect for stakeholders and sponsors.
Recommended working order
There is no mandatory order, but for a brand-new problem we recommend: CRT → EC → FRT → PRT → TT. If you already have a clear hypothesis about the underlying conflict, you can start with the EC. In our example project we start with the EC because the conflict — «respond fast» vs. «respond accurately» — is obvious to anyone on the support team.
5. Evaporating Cloud (EC)
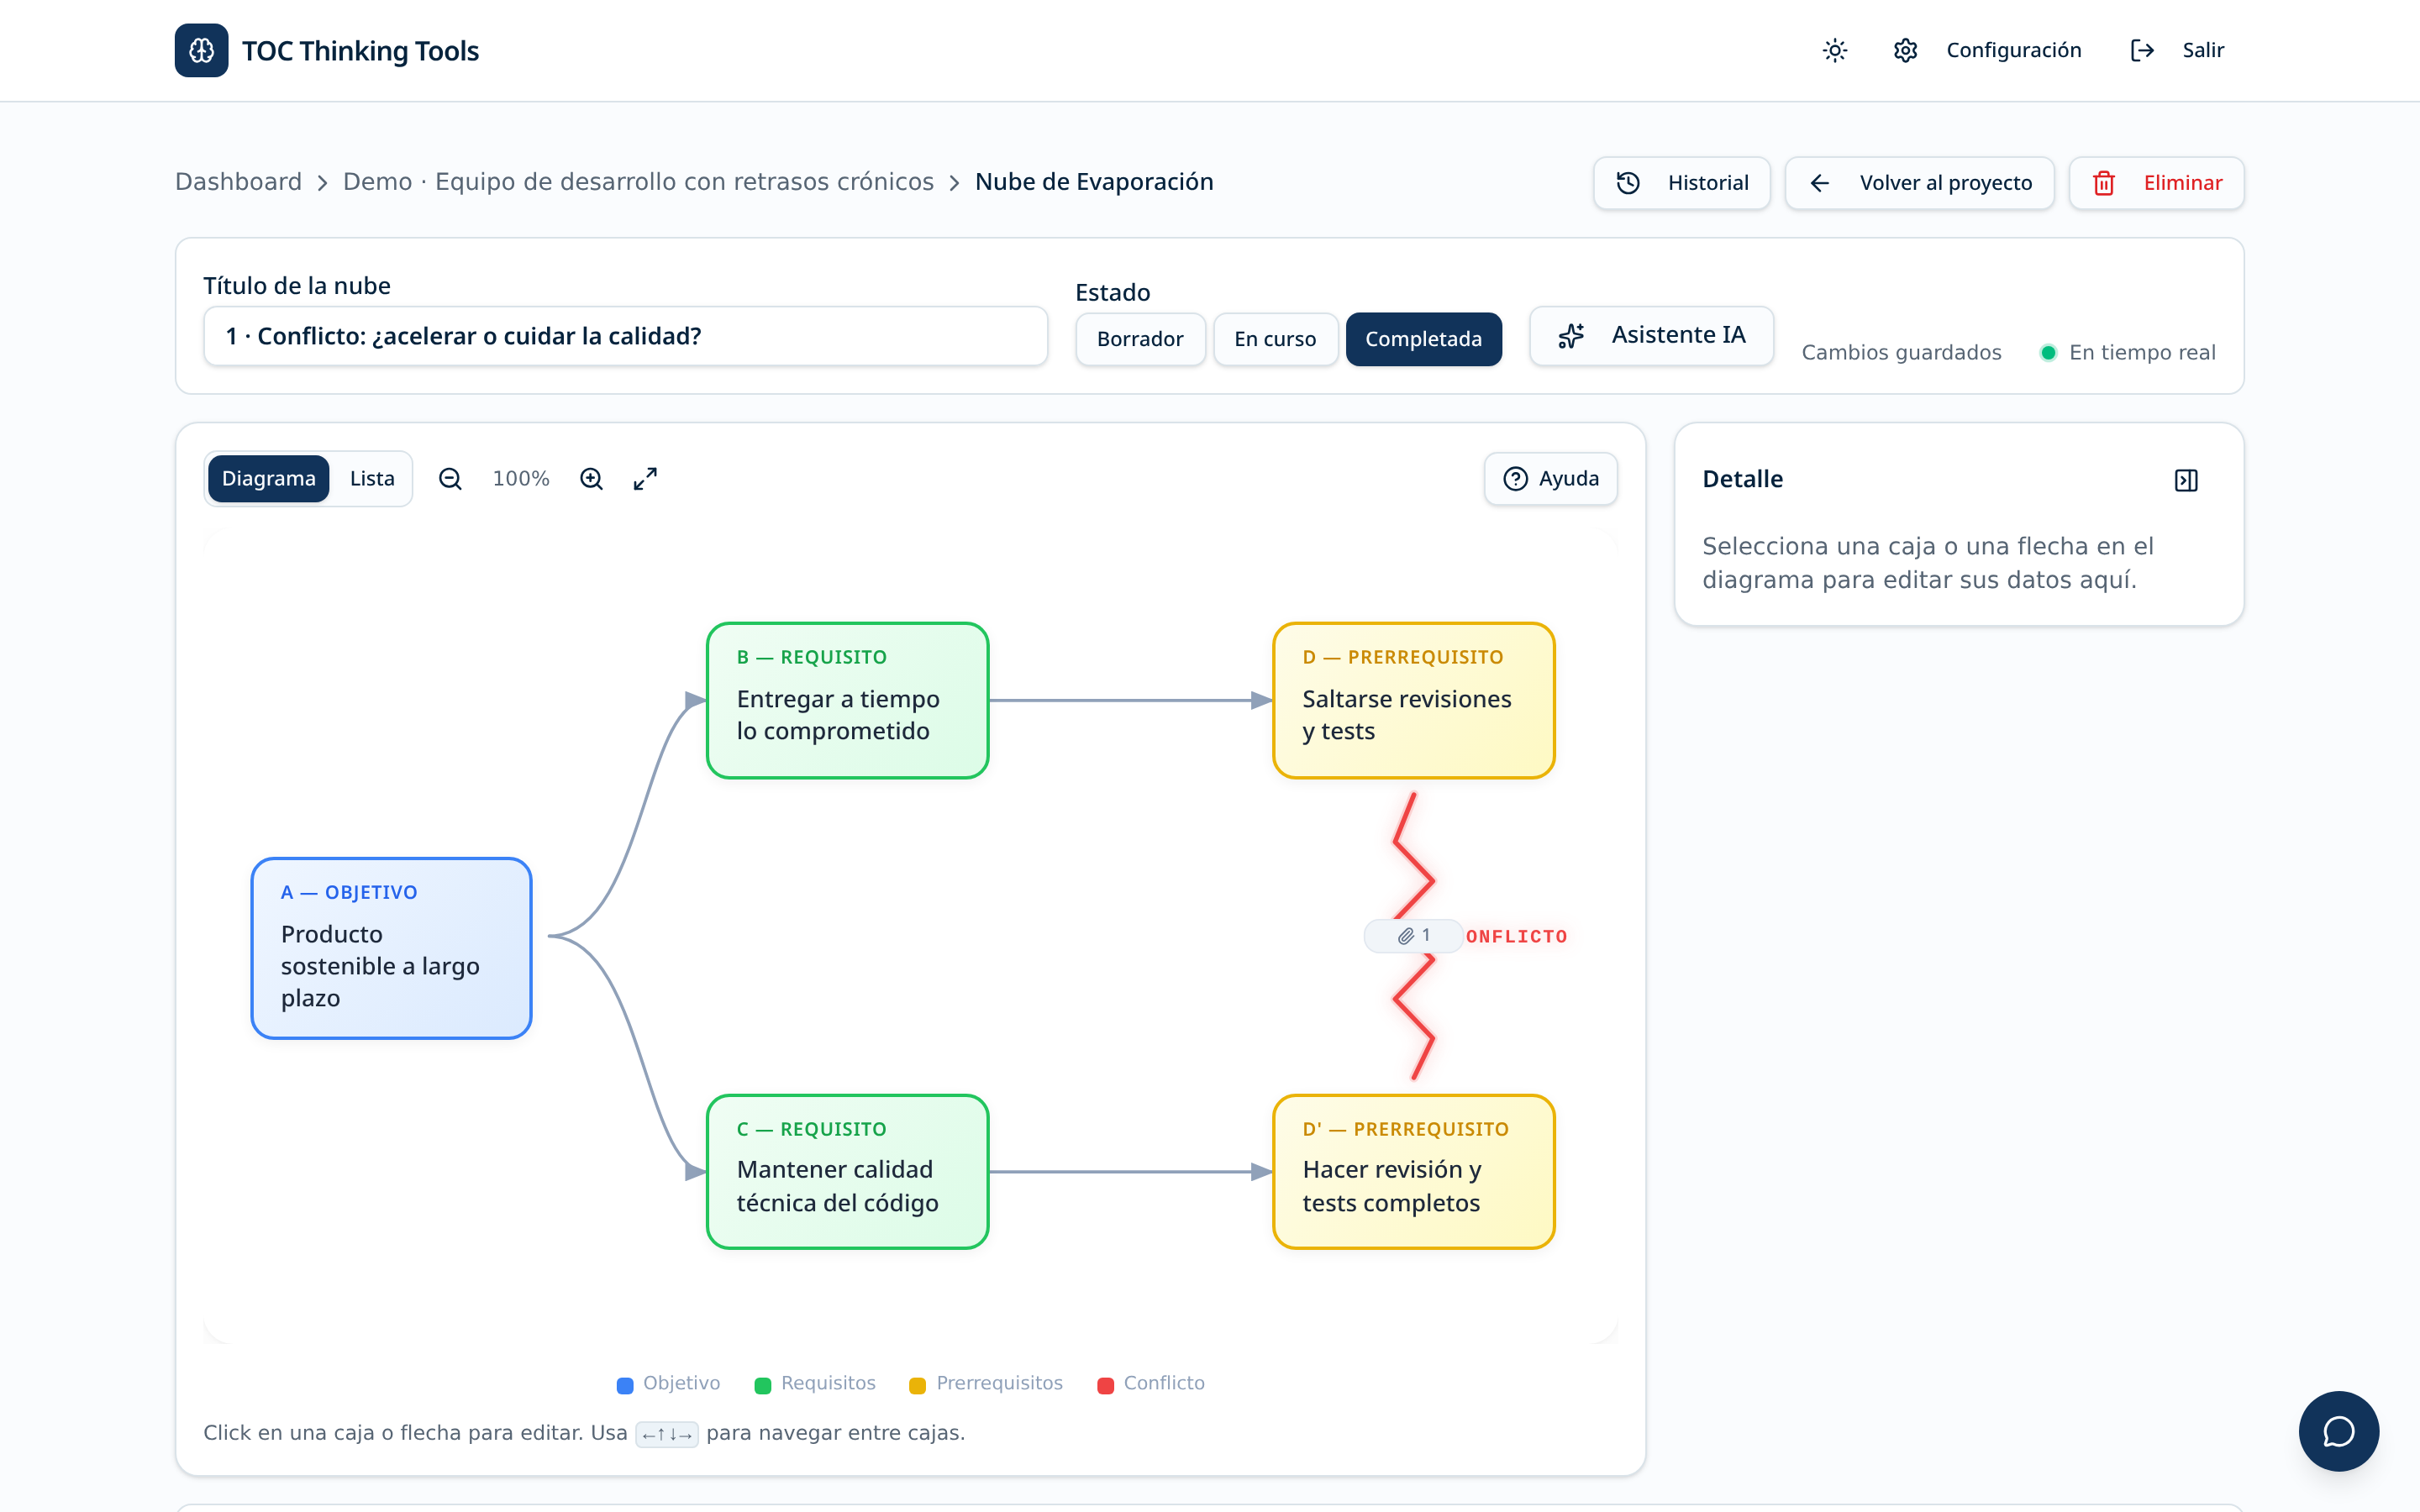
The EC maps a chronic conflict: a common objective (A), two requirements in tension (B and C) and the opposite prerequisites (D and D′). Your goal is to identify the assumptions behind each arrow and challenge at least one to find an injection that dissolves the dilemma.
Worked example
- A (Objective) — Serve customers sustainably.
- B (Requirement) — Respond fast to every ticket.
- C (Requirement) — Respond accurately, without misleading customers.
- D (Prerequisite) — Reply in under 1 hour.
- D′ (Prerequisite) — Investigate thoroughly before replying.
D and D′ can't both happen for every ticket, and that is the chronic tension the support team lives inside.
Recommended flow
- Fill in the 5 boxes with short, concrete, verifiable sentences.
- For each arrow (B→A, C→A, D→B, D′→C, D↔D′) list the assumptions that hold it up. Do this manually or click AI Assistant → Suggest assumptions.
- Mark the assumption that looks weakest or false — your candidate to challenge. In the example, the challenged assumption is «every ticket needs the same level of investigation before responding.»
- Write one or more injections — real-world changes that invalidate that assumption. Record impact and feasibility. In the example, the winning injection is «triage tickets into fast-path (templated response) and deep-path (investigation) at intake.»
- Change status to Completed and pass the chosen injection to the FRT (to validate it) or to the PRT (to plan it).
Common mistakes
- Confusing the objective A with a solution («Increase sales 20%» is a target, not a TOC objective).
- Picking B and C that are not really in conflict: if D and D′ can happily coexist, there is no cloud.
- Jumping straight to the injection without spelling out the assumptions — you lose traceability and the AI can't help you.
6. Current Reality Tree (CRT)
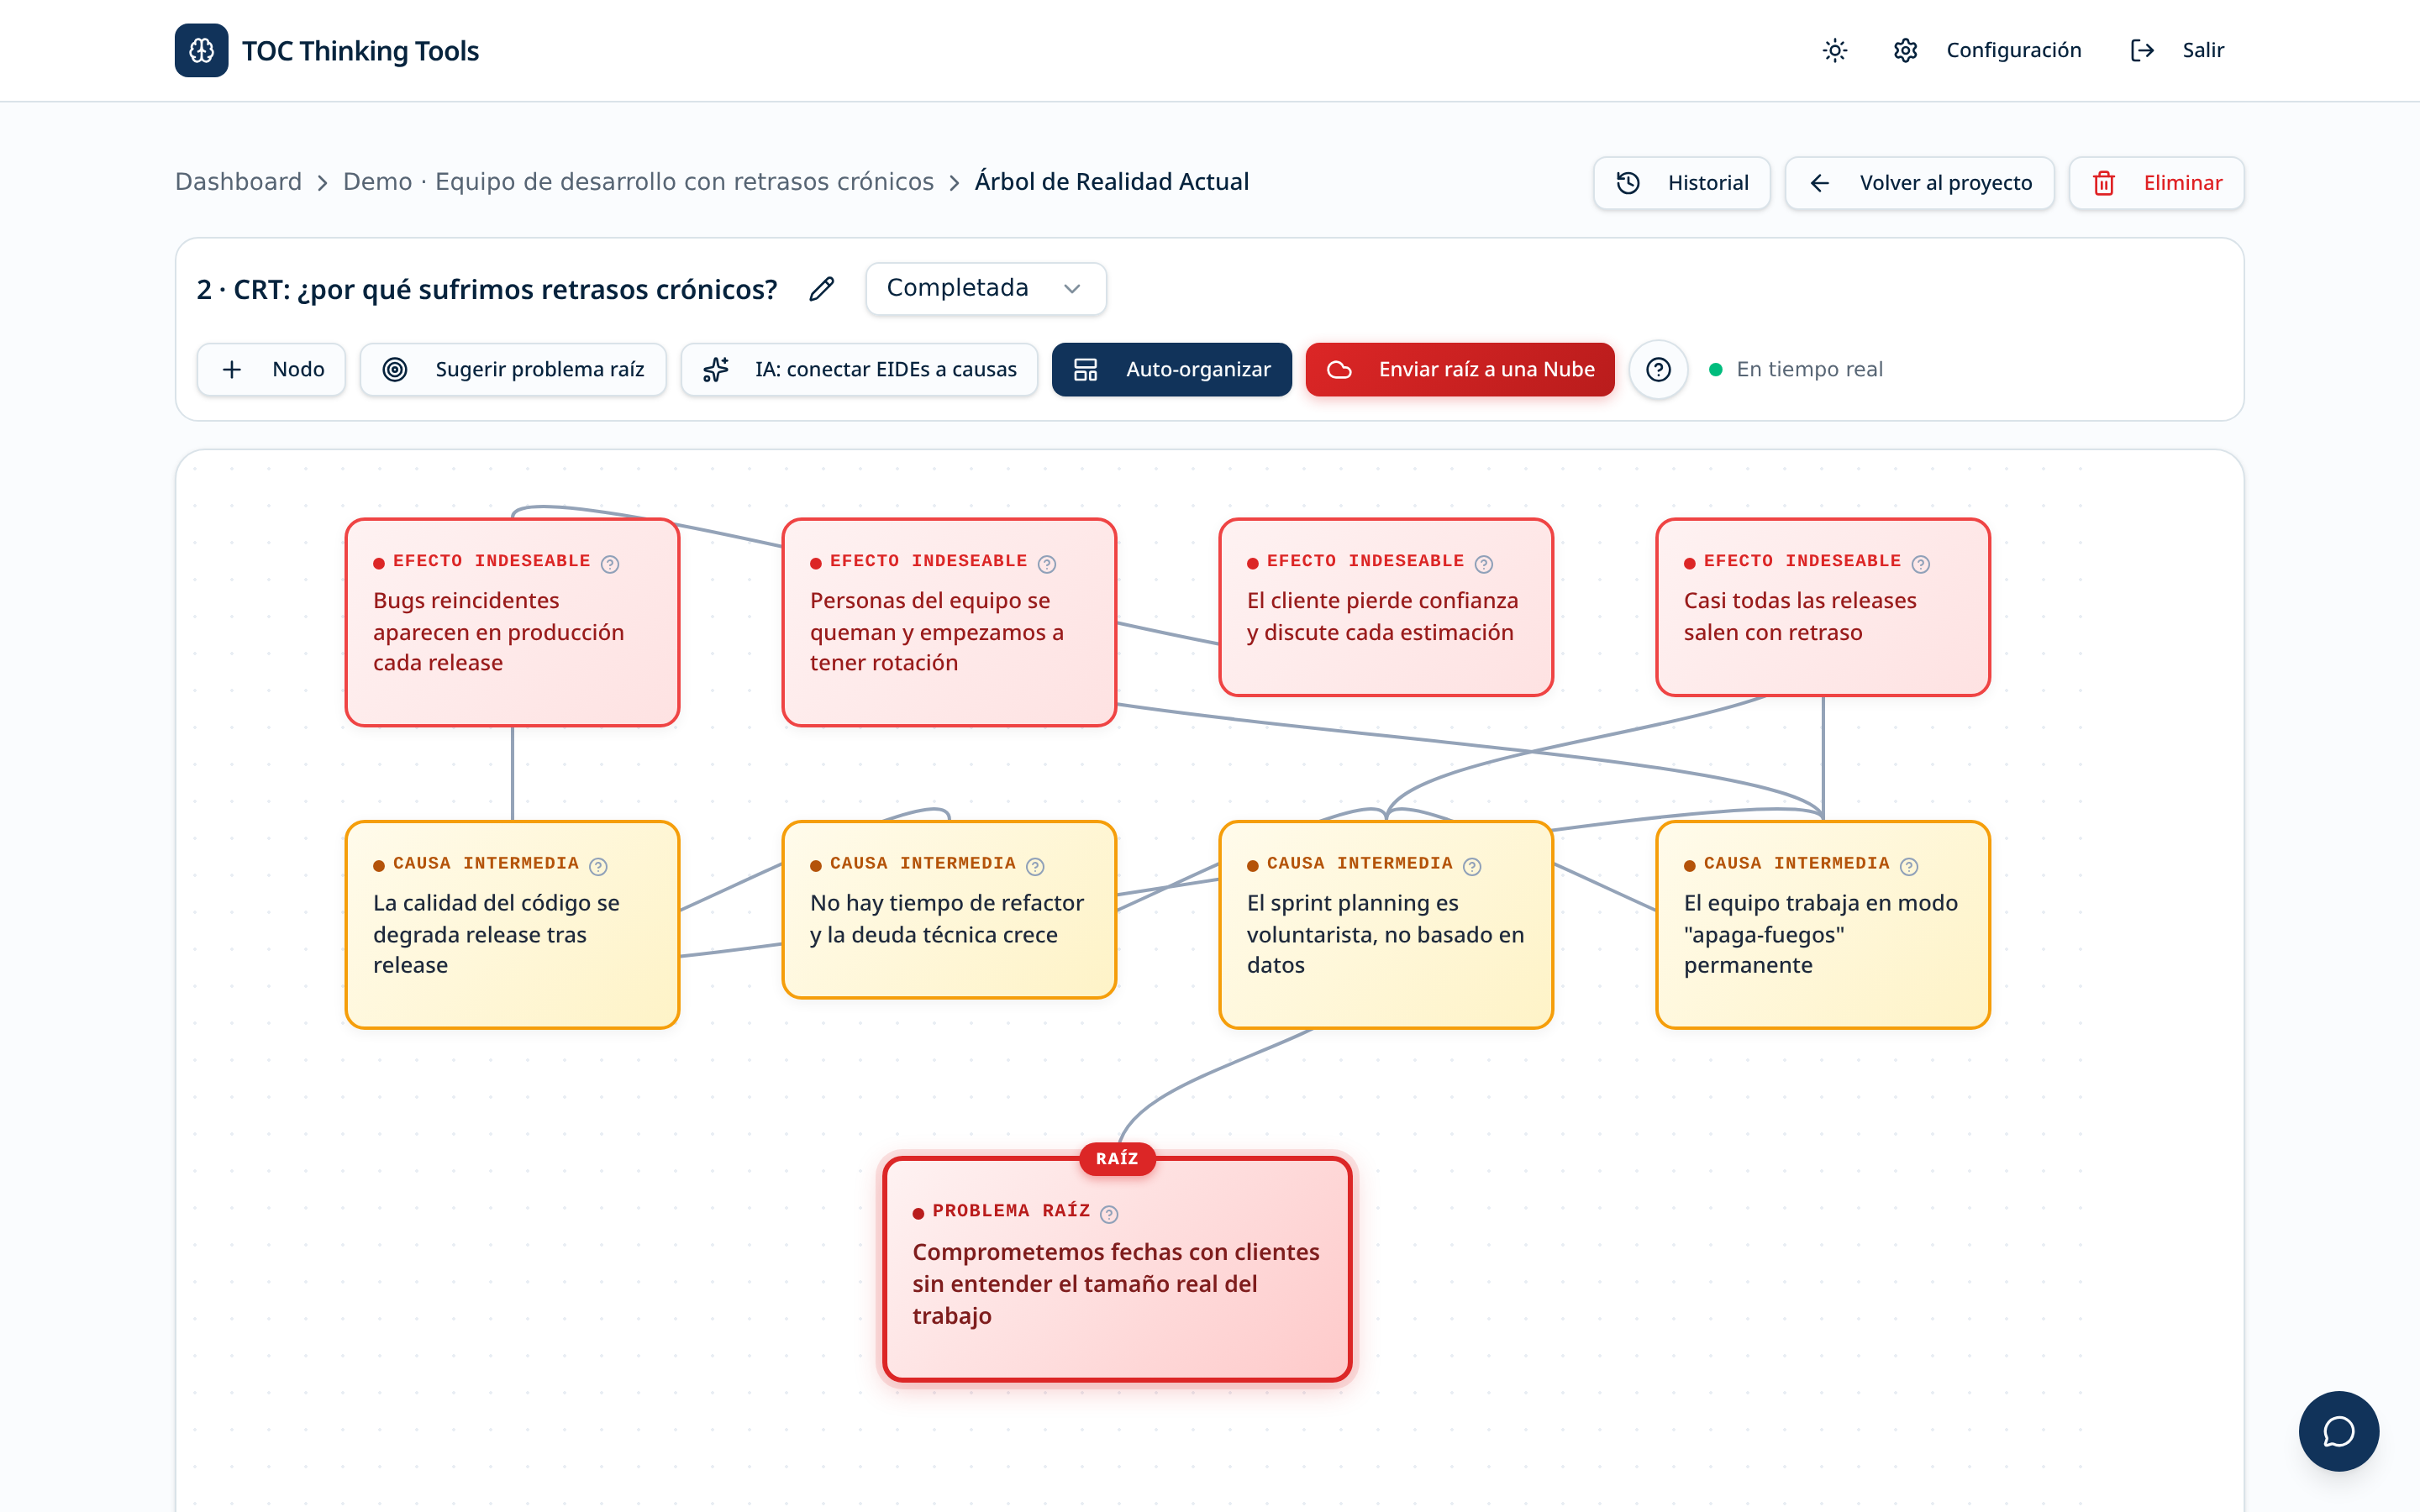
The CRT connects the Undesirable Effects (UDEs) the organization suffers with their root cause. It's a directed graph of cause→effect relationships where, reading bottom-up, you should be able to say: «If this cause occurs, then this effect occurs».
Worked example
Three UDEs in the demo project:
- Average first-response time is above 24h.
- Customers vent publicly on social media.
- The support team is burning out.
Two intermediate causes explain them: «agents can't tell which tickets are urgent at intake» and «every ticket is handled by a single generalist». Both trace back to one root cause: «there is no triage step between ticket arrival and agent assignment.» Notice how one root cause explains all three UDEs — that's what you're looking for.
How to build it
- List 5-10 UDEs that are concrete and observable. A good UDE is a fact, not an interpretation: «Tickets take more than 24h to close», not «Support is broken».
- Cluster related UDEs and look for intermediate causes that explain each cluster.
- Descend layer by layer asking «why does this happen?» until you reach 1-3 root causes that explain most UDEs.
- Validate every arrow with the «If → then» test: if reading it out loud sounds forced, an intermediate cause is missing.
AI Assistant in the CRT
- Detect orphan UDEs — effects with no cause pointing to them.
- Detect causes without effect — nodes that explain nothing.
- Suggest intermediate causes — when two nodes are connected but the logical leap is too big.
- Identify root-cause candidates — nodes explaining more than 60% of UDEs.
Real-time collaboration
The «Real-time» indicator at the top guarantees changes sync with your team in under half a second. You'll see avatars of people viewing the same CRT and a labeled cursor next to the node they're editing. For live workshops, share the project link with Editor role to every participant.
7. Future Reality Tree (FRT)
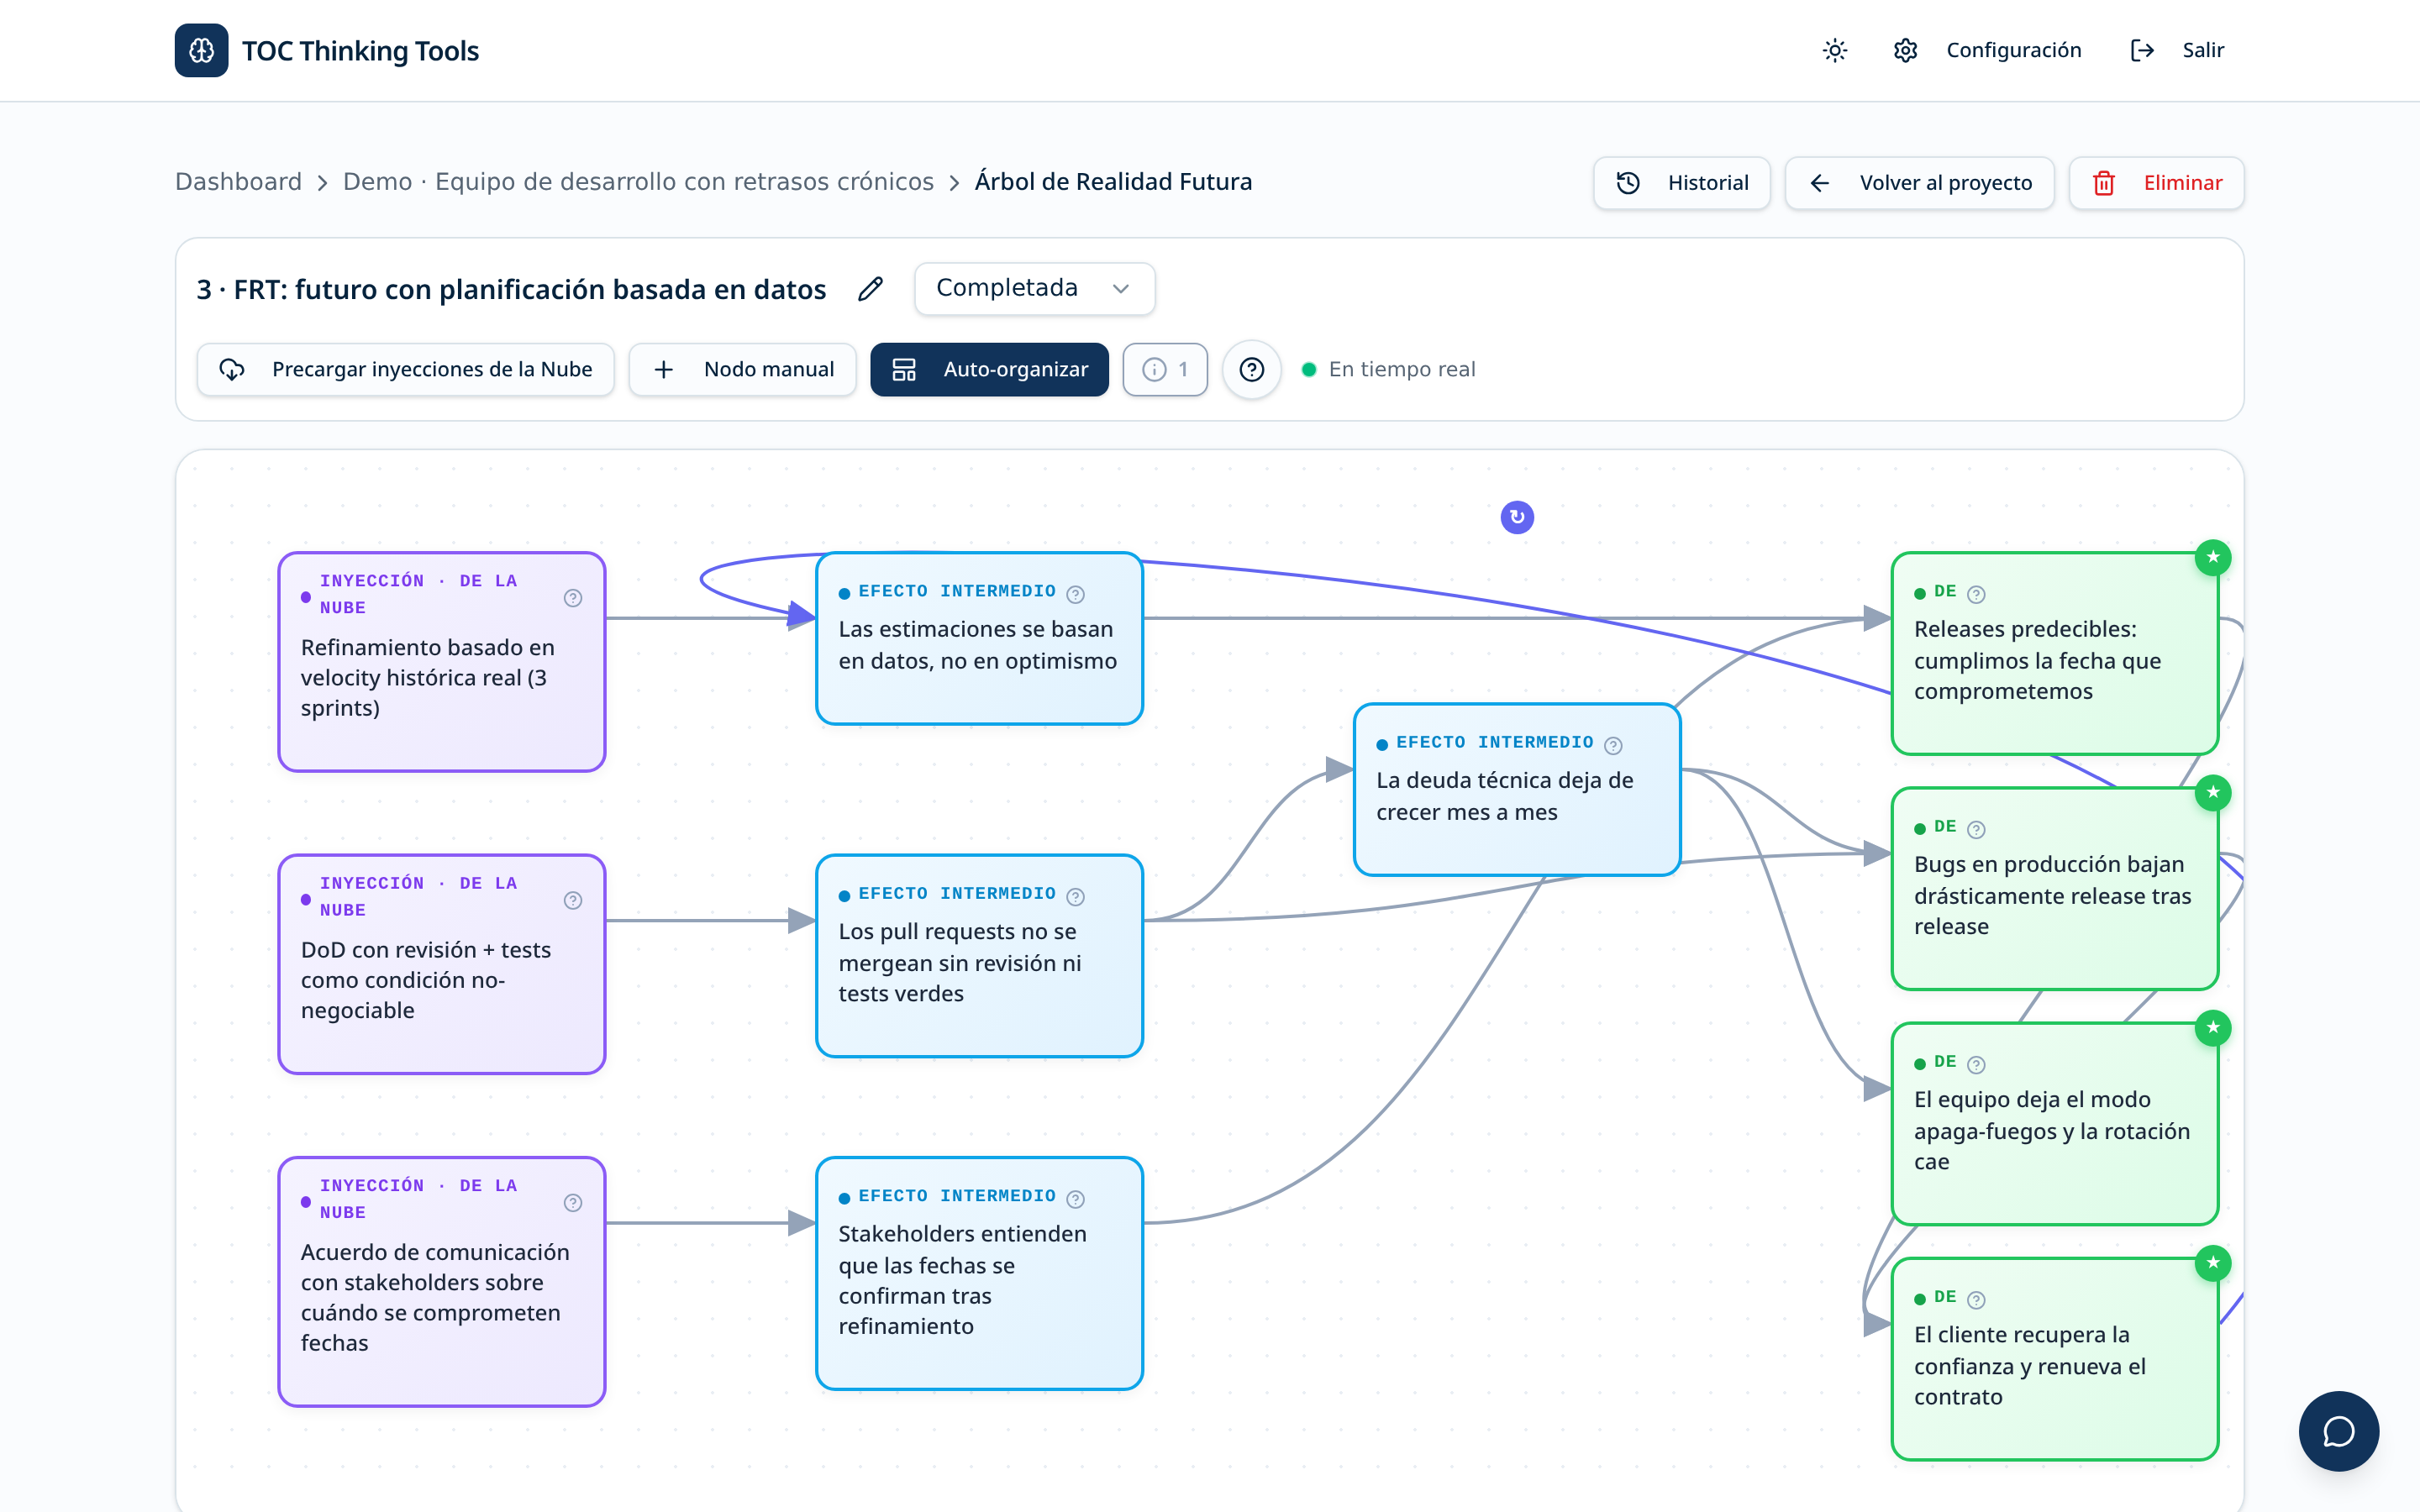
The FRT validates that the injections you chose (typically coming from the EC) produce the Desired Effects (DEs) without introducing new undesirable effects. It's the positive mirror of the CRT.
Worked example
In our demo project the injection is «introduce a triage step with templated fast-path responses.» The FRT projects three desired effects:
- First-response time drops below 4h.
- Customer satisfaction rises (fewer public complaints).
- Support team workload becomes predictable (no more burnout spikes).
We also add one potential collateral negative effect: templates could feel impersonal. The countermeasure — agents personalize the first line before sending — is added as a second injection.
Node types
- Injection — the concrete change you introduce. It must be actionable and under your control.
- Desired Effect (DE) — the positive mirror of each UDE from the CRT.
- Reinforcing loop — when one DE positively feeds another DE, creating a virtuous cycle.
- Collateral negative effect — a new UDE that could appear as a side effect. Spotting it here saves you from production surprises.
Best practices
- Start by copying UDEs from the CRT and turning them into DEs. That guarantees the injection attacks real symptoms.
- Force at least one side-effects branch: ask «what could get worse if I apply this injection?» The goal is not to reject the injection but to design countermeasures.
- If the FRT doesn't reach enough DEs, the injection is weak — go back to the EC and look for a better one.
Logical validation
The editor warns you if an injection reaches no DE, if DEs have no cause pointing to them, if it detects likely collateral negatives you haven't declared, or if the FRT contains logical cycles.
8. Prerequisite Tree (PRT)
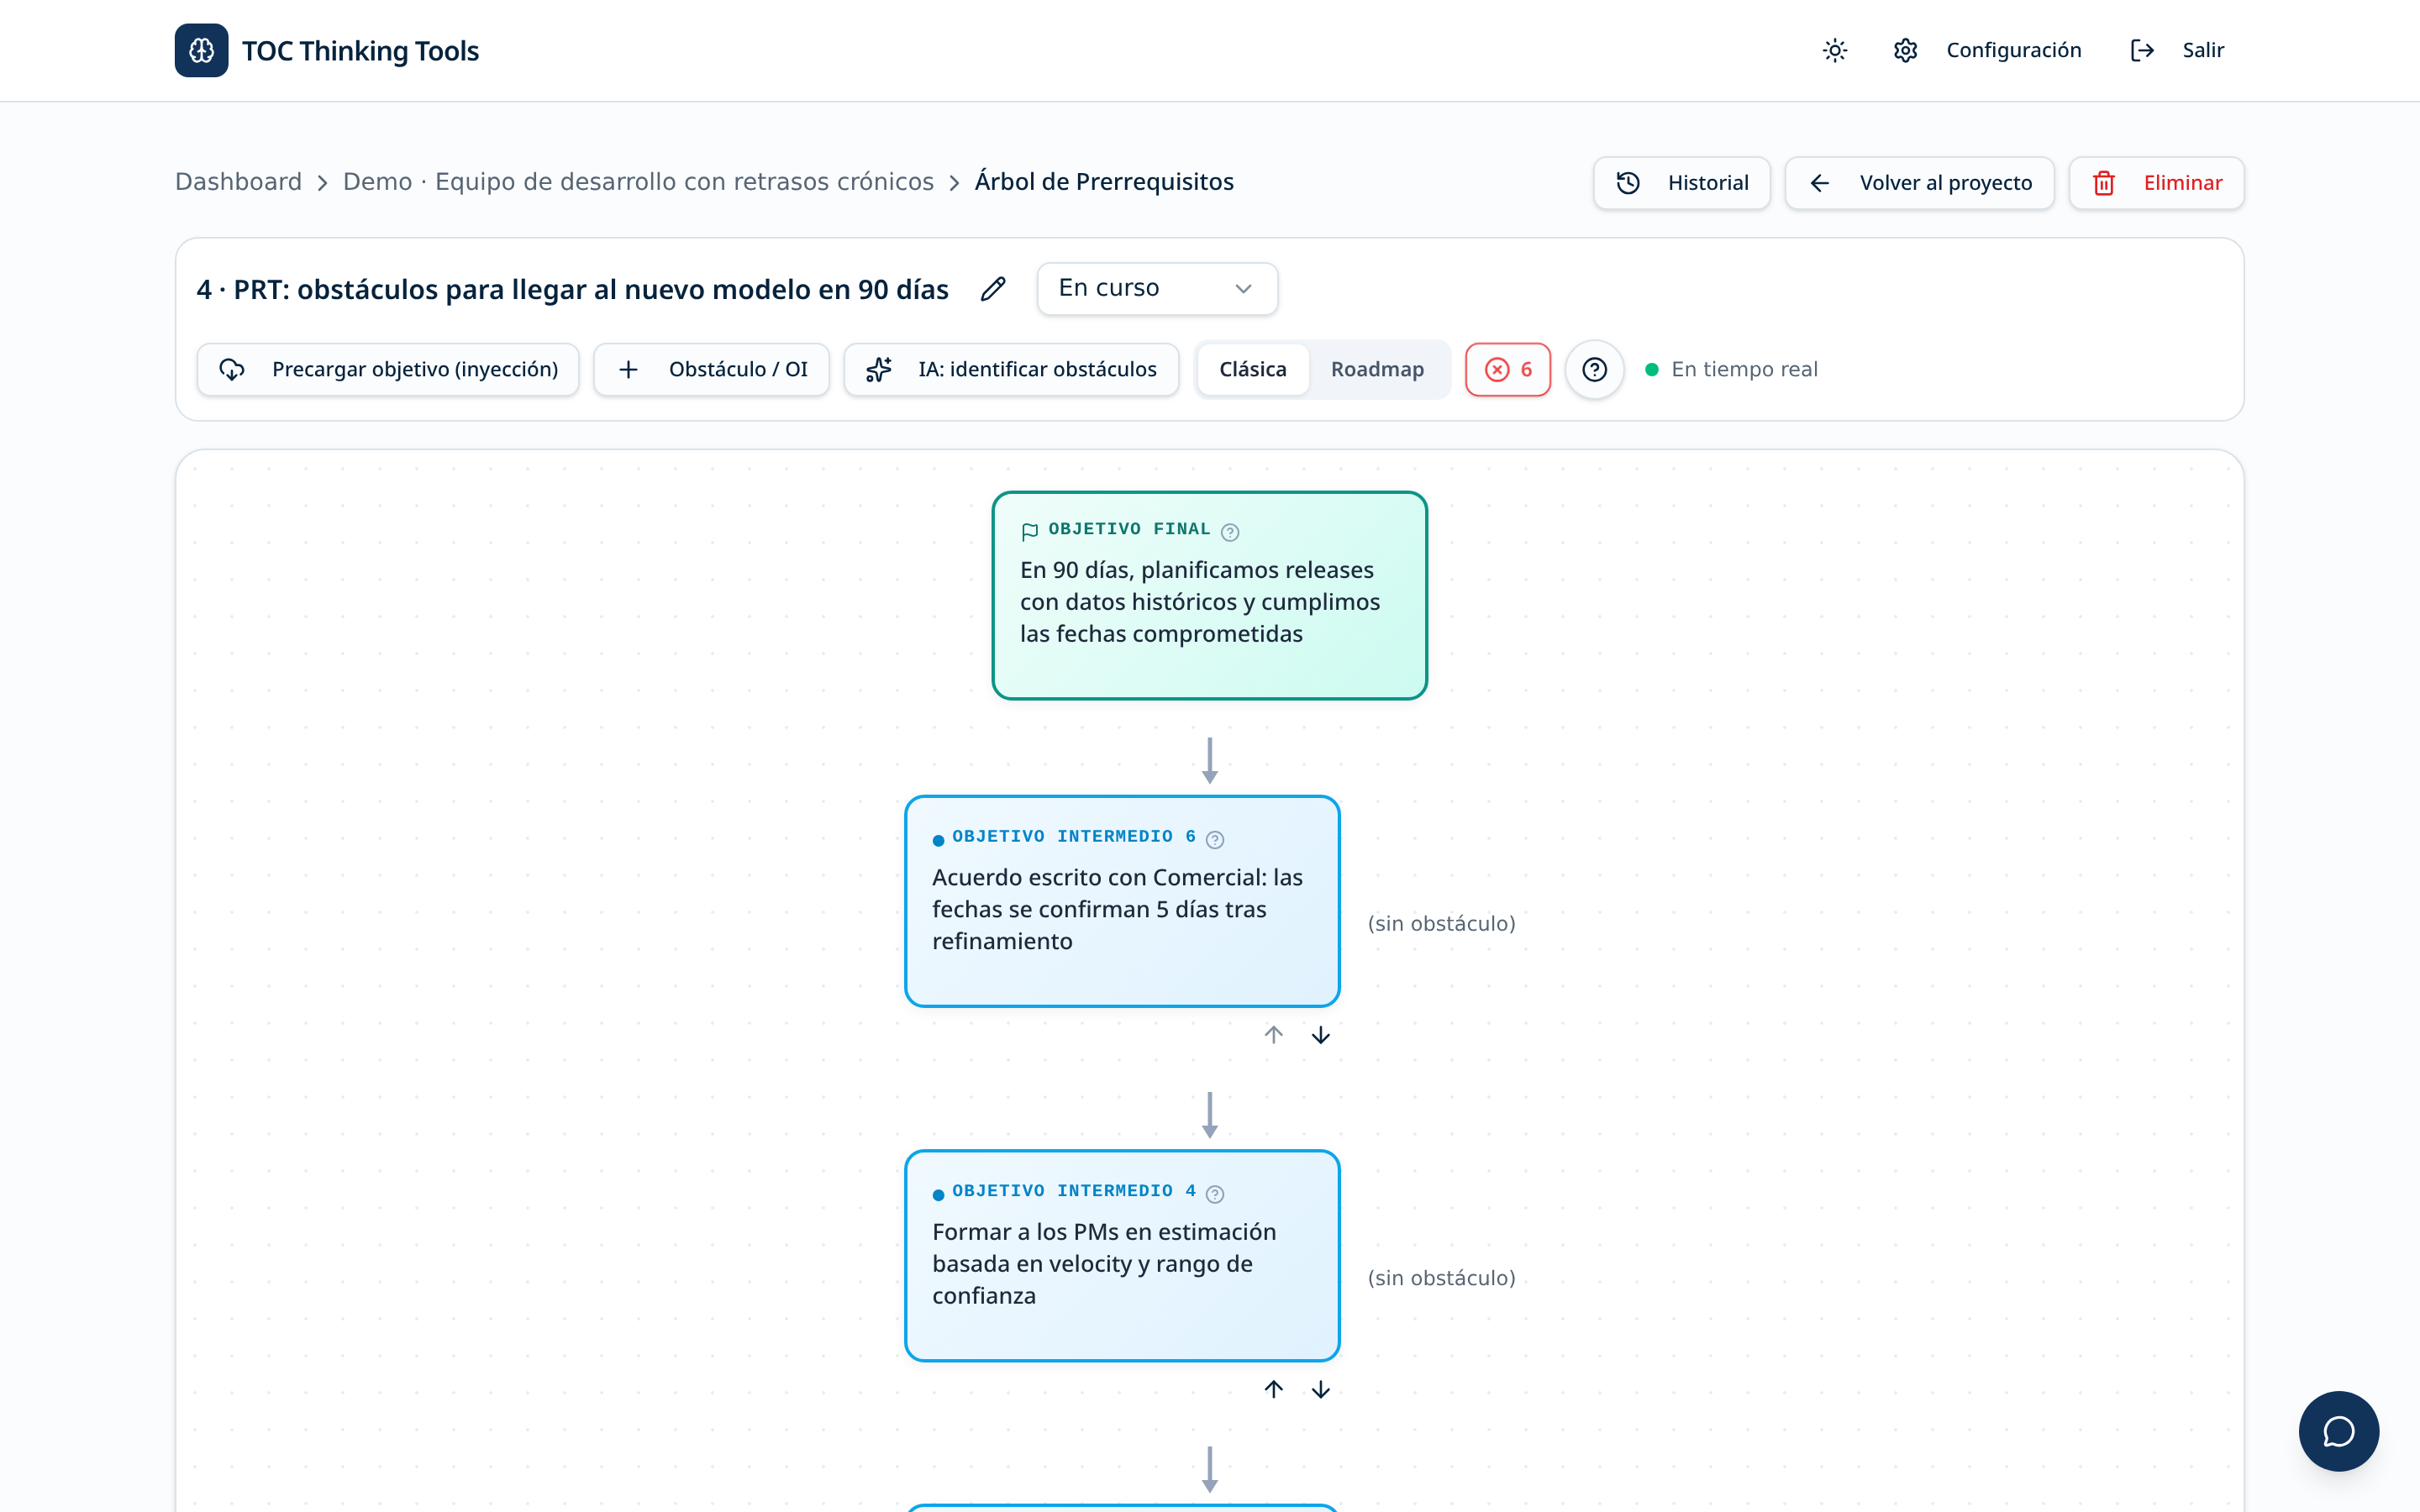
The PRT identifies the obstacles that prevent reaching the objective and, for each one, the Intermediate Objective (IO) that overcomes it. It's the bridge between «what we want to achieve» (FRT) and «how we'll do it» (TT).
Worked example
Final objective: «Ship the triage workflow to production in 90 days.» Two obstacles emerge:
- Obstacle: no shared criteria for what counts as «fast-path». IO: «Triage playbook approved by support lead and reviewed with the team.»
- Obstacle: agents lack templates for the top 20 recurring questions. IO: «Top-20 templates written, reviewed and available in the help desk tool.»
How to work it
- Write the final objective at the top of the tree — same one that motivated the FRT injection.
- Brainstorm obstacles without filtering («no budget», «HR will resist», «no tooling», «legal takes weeks»…). Quantity matters more than quality here.
- Write the IO for each obstacle: the condition that, once met, makes the obstacle disappear. A good IO is concrete and verifiable, not an action («Budget approved by the board», not «Get budget»).
- Order IOs by temporal dependency by dragging them: which IO must be ready before the next one makes sense.
Tip
If an obstacle has no obvious IO, don't hide it: mark it as blocking and escalate it to the sponsor. An honest PRT with unresolved obstacles is far more useful than an invented one that collapses in execution.
9. Transition Tree (TT)
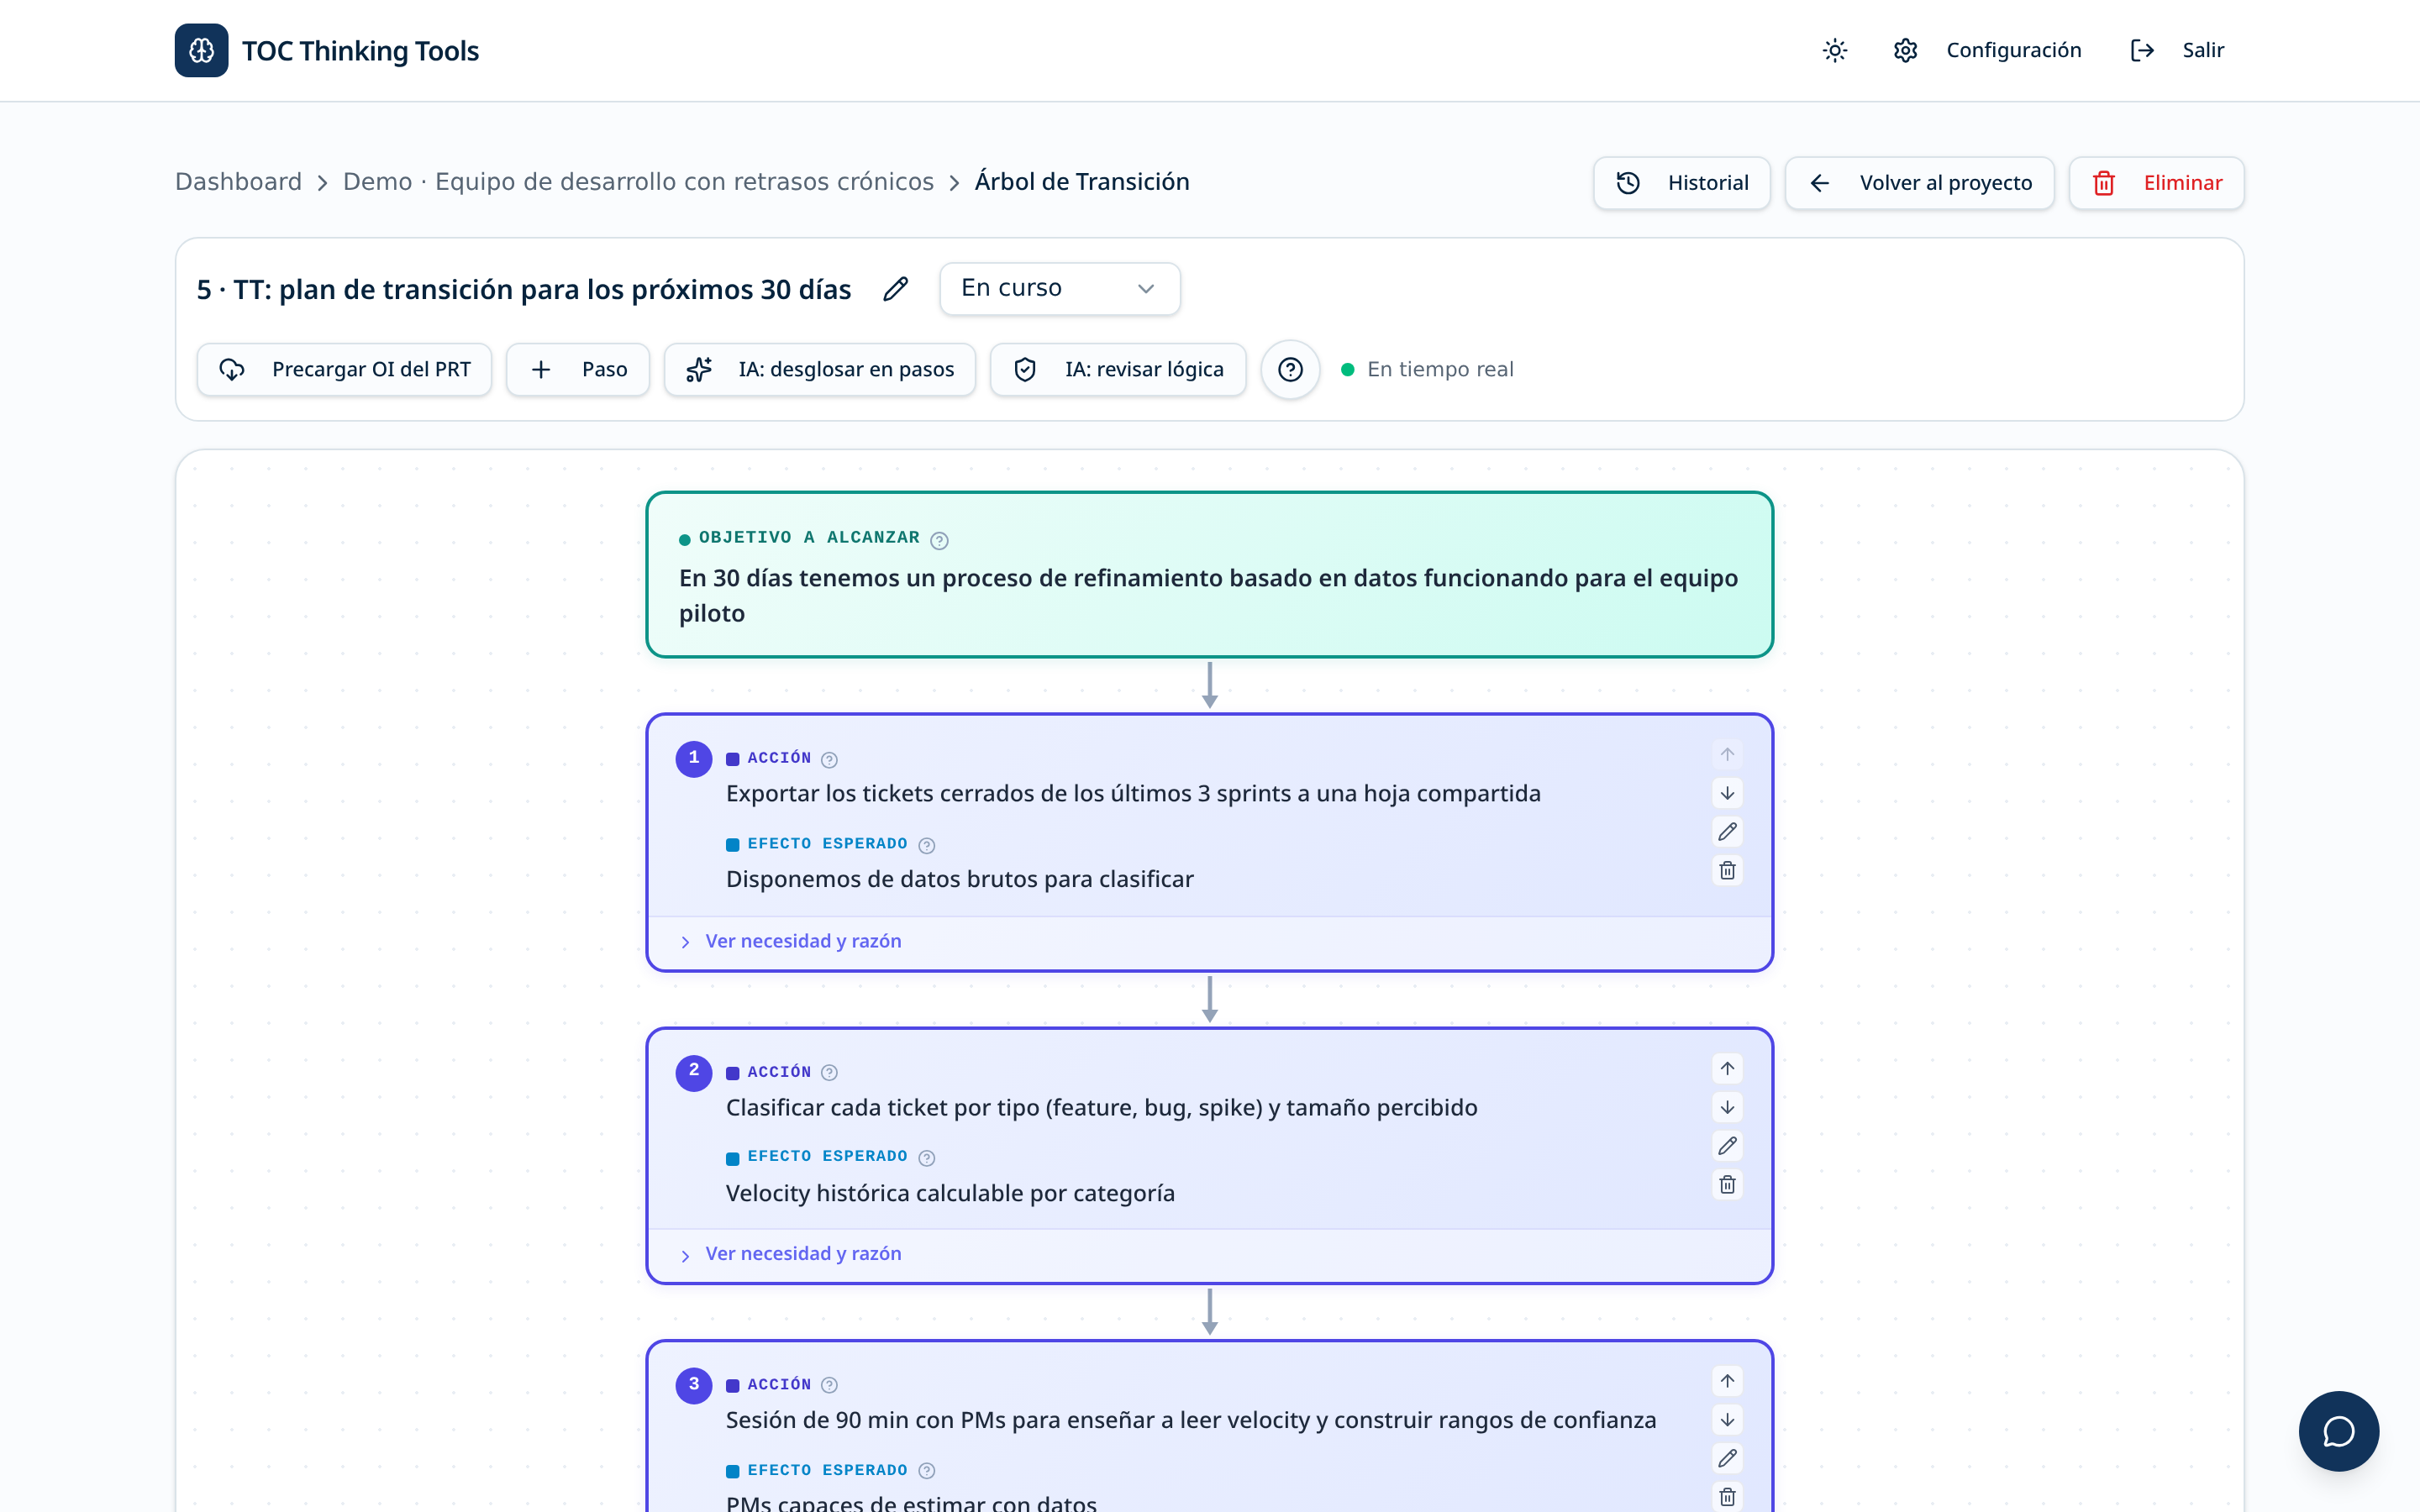
The TT is the detailed action plan: a sequence of steps that move the organization from the current state to the desired future. It turns the PRT's IOs into executable tasks with an owner, a date and a success criterion.
Worked example
Four steps for the demo project:
- Map the current intake flow — support lead, week 1. Success: single-page diagram signed off by the team.
- Define triage criteria and write the fast-path playbook — support lead + senior agent, weeks 2-3. Success: playbook approved.
- Assign a rotating triage owner and instrument SLA metrics — team lead, weeks 4-5. Success: dashboard live with hourly first-response time.
- Pilot with 20% of tickets, then roll out — full team, weeks 6-12. Success: median first-response below 4h for two consecutive weeks.
Anatomy of a step
Every step answers four questions:
- Why is it needed? — which PRT IO it satisfies or which obstacle it removes.
- What to do? — the concrete action, verb-first.
- Who and by when? — a single owner and a target date.
- How will I know it worked? — a measurable success criterion.
Best practices
- One step = one action = one owner. If a step has 3 owners or 5 sub-actions, split it.
- Write the conclusion at the end: what will have changed in the organization once all steps are complete.
- Export the TT to PDF or copy it into your team's task tracker (Jira, Linear, Asana) for operational follow-up.
When every step is complete and validated, the plan is ready to execute. Return to the Dashboard and mark the project as Completed.
10. AI Assistant, contextual help and shortcuts
The platform provides three layers of intelligent support and several shortcuts that dramatically speed up daily work.
1. AI Assistant in each tool
An AI Assistant button lives inside every editor (EC, CRT, FRT, PRT, TT). It adapts its prompts to the active tool: suggests assumptions in the EC, detects orphan UDEs in the CRT, proposes DEs in the FRT, IOs in the PRT and steps in the TT. Every call is logged in the Reasoning history with the proposal and whether it was accepted or rejected.
2. Floating help chat
Bubble icon in the bottom-right corner (visible on every screen). Ask anything about TOC methodology or how to use the app — the assistant knows which tool and project you're in. Free plan: 10 queries/day per user; expanded on Pro and Team.
3. Logical validation
Every tool validates in real time by combining deterministic rules (orphans, cycles, cardinality) with a semantic AI layer (coherence, redundancy, logical leaps). You'll see error/warning badges in the top bar and markers on the problematic nodes.
Useful shortcuts
- N — new node at the cursor position (in graph editors).
- Ctrl/⌘ + K — open the global search for projects and tools.
- Ctrl/⌘ + Z — undo the last change (multi-user aware).
- Drag between nodes — create a cause→effect arrow.
- Double-click the canvas — create a node quickly.
Export and print
Any tool can be exported to PDF, snapshotting the current state (nodes, arrows and comments). Useful for taking the analysis to offline meetings or attaching it to a report. This manual can also be downloaded as PDF from the Download PDF button in the header.
Need more?
Write to us from the contact page or use the floating help chat. You can also download this manual as PDF.